You are a system administrator, managing a set of servers. As a part of your job, you need to ensure that all the servers are up and running 24X7, they are resources are utilized optimally. And that no single server is overloaded or consuming huge memory or some similar abnormal behavior over a time period. Obviously, you will be needing a monitoring tool. Munin is one such tool, which helps system administrators to keep track of system resources.
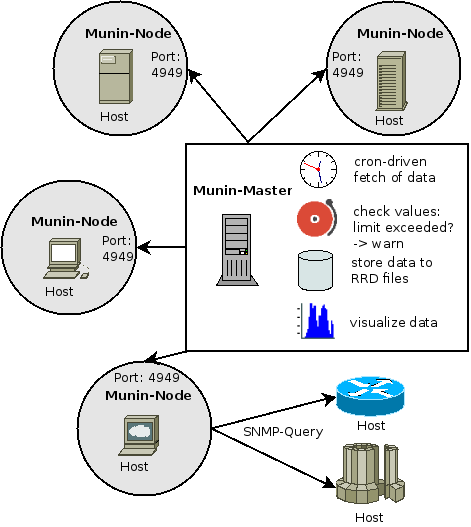
Munin Architecture
Munin derives its name from mythology. It means memory. This monitoring software memorizes what it sees and hence the name.
This monitoring tool uses Master-node architecture. Master periodically pulls data from all the configured nodes and processes it to create graphical dashboards.
One of the advantages of Munin is its vast plugin eco-system. There are several hundred plugins available, which make it a powerful monitoring system. Munin itself uses RRDTool, which is written in Perl, whereas plugins could be written in any language. This tool is available on various distros such as Debian, Ubuntu, and CentOS.

Alternate Server Monitoring Tools
Several alternatives are available.
- Nagios
- NewRelic
- Netdata
- Zabbix
- …
Considering that most of the deployments are in the cloud these days, you may want to use the monitoring tools provided by your cloud providers:
- AWS Cloudwatch
- Azure Monitor
- Google Cloud – Stackdriver monitoring
Related Links
Related Keywords
Server Monitoring, AWS Cloudwatch, Azure Monitor, Nagios, NewRelic