Nowadays, having several servers, load-balancers, API Gateways, and storage devices is a common thing. However, keeping the infrastructure up and running is still a complex task. The administrators need to identify potential problems due to the high availability requirement of several businesses. They strive to have the best tools at their disposal to ensure that they can see the trends and patterns about the health of the infrastructure. Prometheus is an open-source tool that is used to record real-time metrics and making it available through a flexible query model.
What is Prometheus?
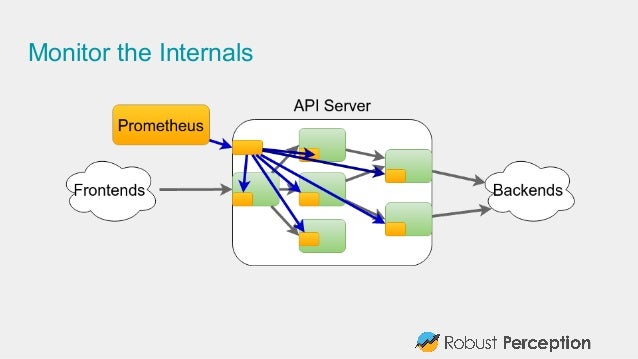
Prometheus is a monitoring platform that collects several metrics from the systems being monitored. This is done by scraping HTTP endpoints on the target systems. It employs HTTP Pull model to retrieve the data at a periodic interval from the monitored systems. Also, it records real-time metrics in time series database and provides a

Architecture
Prometheus involves a server which periodically scrapes the data from monitored systems over HTTP. For this, it needs a component or agent to be running on the monitoring systems.
Prometheus is made up of multiple components/tools such:
- Exporters – they run on monitored systems to export host metrics
Central server to pull and store the metrics- Flexible query language – PromQL – used to create dashboards and alerts.
Alertmanager to trigger alerts based on those metrics- Dashboard using Grafana
It provides libraries in several languages to instrument the application code. By instrumenting the application code, the developers can expose the relevant metrics. This data is then captured and stored by Prometheus. The data can be multi-dimensional. The PromQL helps developers query and build dashboards and alerts as per their need.
History
As one might guess, the roots of this tool go to Ex-googlers working at SoundCloud. They developed this platform to monitor SoundCloud infrastructure. It later was made open-source for the benefit of
Related Links
Related Keywords
Kuberenetes, High Availability, Sidecar, Infrastructure, Cloud, AWS,
One Reply to “Prometheus”